Multivariate Statistics: Using the Right Tool for the Job

Eric R. Scott

Learning Objectives

  • Understand when to apply multivariate tools
  • Understand the difference between supervised/constrained and unsupervised/unconstrained
  • Interpret score and loading plots
  • Match research questions to supervised/unsupervised analyses
  • Install an R package from Bioconductor
  • Find help for “generic” functions
  • Implement PCA and PLS-DA with R code

What is “multivariate” data?

  • Many things measured on the same sample/observation
  • Multiple response/dependent variables = “multivariate”

    Examples:

    • How is species composition impacted by burning?

    • How are plant metabolites impacted by herbivory?

    • How does treatment effect gene expression?

  • Multiple predictor/independent variables = “multivariable”

    Examples:

    • How does species composition effect ecosystem productivity?

    • How does plant metabolite blend effect herbivory?

    • How does gene expression effect disease state?

Challenges of multivariate data

  • “Traditional” statistics can’t handle multiple response variables

  • Variables are often correlated and not fully independent (“multicollinearity”)

  • More variables than observations (“curse of dimensionality”)

  • How to determine importance of individual variables

Cupcakes vs. Muffins

  • Sample of 30 cupcake & muffin recipes scraped from allrecipes.com with frosting ingredients removed1

  • 40 ingredients, units standardized in US cups (although this is not necessary for multivariate data analysis)

  • You can think of the ingredients for each recipe like species, gene transcripts, chemicals, OTUs, or whatever fits your discipline

  • You can think of type (cupcake or muffin) as whatever treatment or site difference fits your discipline

The Data

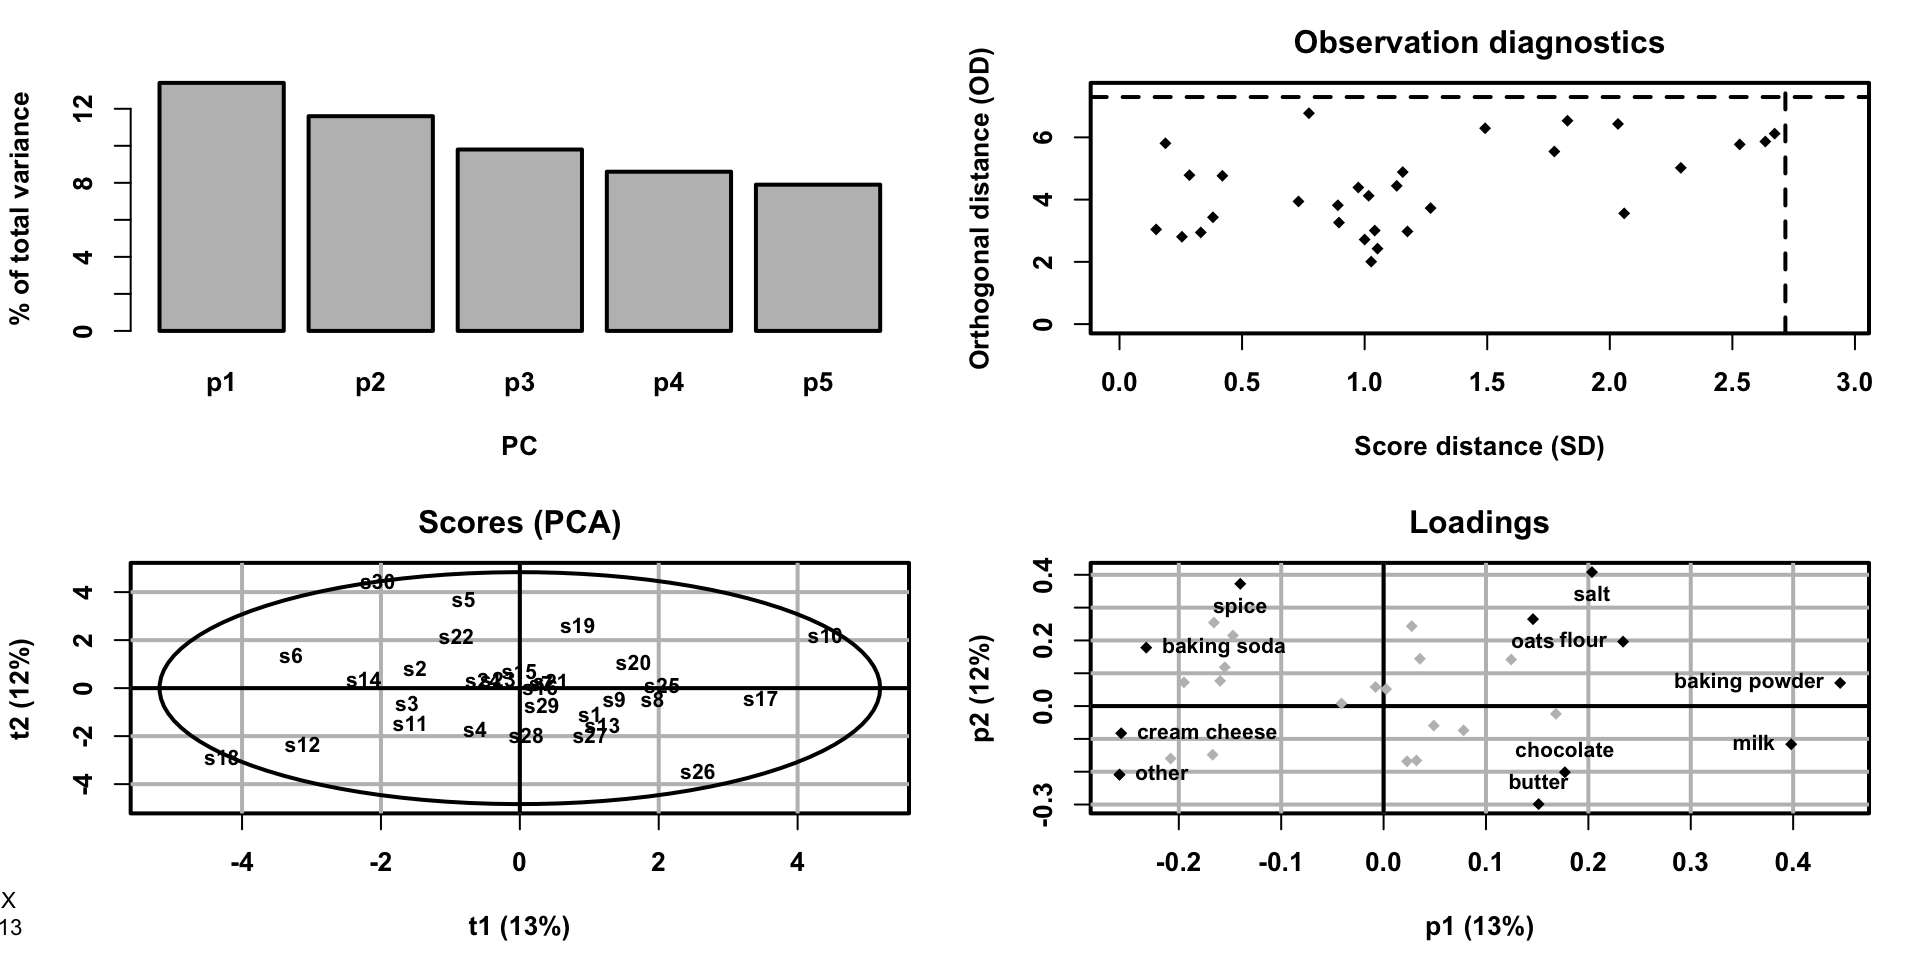
baked_goods <- read_csv("https://raw.githubusercontent.com/cct-datascience/CALS-workshops/main/202302-multivariate/baked_goods.csv")
head(baked_goods)
# A tibble: 6 × 31
  type    recipe_id baking pow…¹ baking …²  butter butterm…³ chocolate
  <chr>       <dbl>        <dbl>     <dbl>   <dbl>     <dbl>     <dbl>
1 Cupcake    145206     0.00174   0.000868 0          0         0     
2 Cupcake    240140     0.000868  0.000694 0.0167     0         0     
3 Cupcake    161019     0.000868  0.00174  0          0.0417    0.0339
4 Muffin      16945     0         0        0.0741     0         0     
5 Muffin     228562     0.00116   0.00231  0.00694    0         0     
6 Cupcake    215375     0.00130   0.000651 0          0         0     
# … with 24 more variables: cornmeal <dbl>, `cream cheese` <dbl>,
#   eggs <dbl>, flour <dbl>, fruit <dbl>, `fruit juice` <dbl>,
#   honey <dbl>, margarine <dbl>, milk <dbl>, nut <dbl>, oats <dbl>,
#   oil <dbl>, other <dbl>, salt <dbl>, `sour cream` <dbl>,
#   spice <dbl>, starch <dbl>, sugar <dbl>, unitless <dbl>,
#   vanilla <dbl>, vegetable <dbl>, vinegar <dbl>, water <dbl>,
#   yogurt <dbl>, and abbreviated variable names ¹​`baking powder`, …

Unsupervised/unconstrained

  • Exploratory
  • Finds axes that explain the variation in the data
  • Single-sided equation (no dependent/independent variables)

Supervised/constrained

  • Explanatory
  • Finds axes that best separate multivariate data along some variable (e.g. cupcakes vs. muffins)

Results: unsupervised (PCA)

Results: supervised (PLS-DA)

Use the right tool for the job

Two different questions answered:

  1. Unsupervised: Do muffins and cupcakes differ in the ingredients that vary most among them?
  2. Supervised: Do muffins and cupcakes differ? What ingredients make them different?

Important

Most of the time, if you are looking to test a hypothesis, you have a supervised type question unless the main axis of variation is of particular interest. E.g. “Do muffins and cupcakes tend to have different leavening systems?”

R Packages for Multivariate Analysis

  • There are many R packages for multivariate data analysis, but not one perfect package

  • vegan is a good toolkit, with extensive documentation, but the language is very specific to community ecology

  • ropls a good option if you’re interested in PCA or PLS and its variants (a supervised technique), but the UI is unusual and it uses S4 objects which are harder to work with

  • ade4 package is a good toolkit, but documentation is terse and written for someone who is already a stats wiz

  • If you just need principal components analysis (PCA), this can be done in base R with prcomp()

PCA with base R

  1. Extract just the ingredients columns
library(dplyr)
ingredients <- baked_goods |> select(-type, -recipe_id)
head(ingredients)
# A tibble: 6 × 29
  baking po…¹ baking …²  butter butterm…³ chocolate cornmeal cream c…⁴
        <dbl>     <dbl>   <dbl>     <dbl>     <dbl>    <dbl>     <dbl>
1    0.00174   0.000868 0          0         0             0    0     
2    0.000868  0.000694 0.0167     0         0             0    0.0333
3    0.000868  0.00174  0          0.0417    0.0339        0    0     
4    0         0        0.0741     0         0             0    0     
5    0.00116   0.00231  0.00694    0         0             0    0     
6    0.00130   0.000651 0          0         0             0    0.0312
# … with 22 more variables: eggs <dbl>, flour <dbl>, fruit <dbl>,
#   `fruit juice` <dbl>, honey <dbl>, margarine <dbl>, milk <dbl>,
#   nut <dbl>, oats <dbl>, oil <dbl>, other <dbl>, salt <dbl>,
#   `sour cream` <dbl>, spice <dbl>, starch <dbl>, sugar <dbl>,
#   unitless <dbl>, vanilla <dbl>, vegetable <dbl>, vinegar <dbl>,
#   water <dbl>, yogurt <dbl>, and abbreviated variable names
#   ¹​`baking powder`, ²​`baking soda`, ³​buttermilk, ⁴​`cream cheese`

PCA with base R

  1. Do PCA with prcomp()
baked_pca <- prcomp(ingredients, scale. = TRUE)

Note

It is usually advised to scale and center variables before doing multivariate analyses like PCA. You can do this in prcomp() with the scale. = TRUE argument, or before running PCA using the scale() function.

PCA with base R

  1. Inspect results and decide how many axes to “retain”
summary(baked_pca)
Importance of components:
                          PC1    PC2     PC3     PC4     PC5     PC6     PC7
Standard deviation     1.9737 1.8379 1.68784 1.57981 1.50967 1.41547 1.37242
Proportion of Variance 0.1343 0.1165 0.09823 0.08606 0.07859 0.06909 0.06495
Cumulative Proportion  0.1343 0.2508 0.34904 0.43511 0.51370 0.58278 0.64773
                          PC8     PC9    PC10    PC11    PC12    PC13    PC14
Standard deviation     1.2947 1.11086 1.08492 1.01494 0.96451 0.91007 0.83833
Proportion of Variance 0.0578 0.04255 0.04059 0.03552 0.03208 0.02856 0.02423
Cumulative Proportion  0.7055 0.74808 0.78867 0.82419 0.85627 0.88483 0.90907
                          PC15   PC16    PC17    PC18   PC19    PC20    PC21
Standard deviation     0.77799 0.6959 0.67063 0.52921 0.4785 0.44377 0.34799
Proportion of Variance 0.02087 0.0167 0.01551 0.00966 0.0079 0.00679 0.00418
Cumulative Proportion  0.92994 0.9466 0.96215 0.97180 0.9797 0.98649 0.99067
                          PC22    PC23    PC24    PC25    PC26    PC27    PC28
Standard deviation     0.32268 0.25521 0.23283 0.16225 0.13071 0.05266 0.03129
Proportion of Variance 0.00359 0.00225 0.00187 0.00091 0.00059 0.00010 0.00003
Cumulative Proportion  0.99426 0.99650 0.99837 0.99928 0.99987 0.99996 1.00000
                           PC29
Standard deviation     0.007944
Proportion of Variance 0.000000
Cumulative Proportion  1.000000

PCA with base R

  1. Visualize results
# biplot
biplot(baked_pca)
#or extract scores and loadings and build your own!
scores <- baked_pca$x
loadings <- baked_pca$rotation

Now you try!

Do PCA on the Palmer penguins dataset using bill length, bill depth, flipper length, and body mass as variables of interest.

library(palmerpenguins)
head(penguins)
# A tibble: 6 × 8
  species island   bill_le…¹ bill_de…² flipper…³ body_ma…⁴ sex    year
  <fct>   <fct>        <dbl>     <dbl>     <int>     <int> <fct> <int>
1 Adelie  Torgers…      39.1      18.7       181      3750 male   2007
2 Adelie  Torgers…      39.5      17.4       186      3800 fema…  2007
3 Adelie  Torgers…      40.3      18         195      3250 fema…  2007
4 Adelie  Torgers…      NA        NA          NA        NA <NA>   2007
5 Adelie  Torgers…      36.7      19.3       193      3450 fema…  2007
6 Adelie  Torgers…      39.3      20.6       190      3650 male   2007
# … with abbreviated variable names ¹​bill_length_mm, ²​bill_depth_mm,
#   ³​flipper_length_mm, ⁴​body_mass_g

Tip

You’ll need to remove rows with NA. One way to do this is with the drop_na() function from the tidyr package. E.g.:

data |> select(col1, col2) |> drop_na()

Using the ropls package

  • ropls is a powerful R package for principal component analysis (PCA) and partial least squares regression (PLS)

  • Includes model diagnostics and permutation test statistics by default

  • Decent plots

  • Must install from Bioconductor

  • User interface is unusual and can be confusing

PCA with ropls

  1. Install ropls
# install instructions copied from ropls page:
# https://bioconductor.org/packages/release/bioc/html/ropls.html

# install BiocManager
if (!require("BiocManager", quietly = TRUE))
    install.packages("BiocManager")

# use bioconductor to install ropls
BiocManager::install("ropls")

PCA with ropls

  1. Do PCA

There’s just one function, opls(), that does PCA, or various ‘flavors’ of PLS depending on the arguments you give it. If we give it just x data, it’ll do PCA.

baked_pca2 <- opls(ingredients)

PCA with ropls

PCA
30 samples x 29 variables
standard scaling of predictors
      R2X(cum) pre ort
Total    0.513   5   0

PCA with ropls

  1. Make a better score plot.

How to find help for a generic function like plot()?

#figure out what the object class is
class(baked_pca2)
[1] "opls"
attr(,"package")
[1] "ropls"
#See what methods are available
methods(class = "opls")
 [1] coef         fitted       getEset      getLoadingMN getPcaVarVn 
 [6] getScoreMN   getSubsetVi  getSummaryDF getVipVn     getWeightMN 
[11] plot         predict      print        residuals    show        
[16] tested      
see '?methods' for accessing help and source code
#look for help for that plot method
?plot.opls

PCA with ropls

# score plot
plot(baked_pca2, typeVc = "x-score", parAsColFcVn = baked_goods$type)
# correlation plot
plot(baked_pca2, typeVc = "correlation")

PLS-DA with ropls

  • Partial Least Squares regression (PLS or PLSR) is a supervised multivariable technique

  • Handles multicollinearity (correlated predictors) and more variables than observations exceptionally well

  • When \(Y\) is categorical (e.g. cupcake or muffin), it’s PLS discriminant analysis (PLS-DA)

PLS-DA with ropls

  1. Try ordinary PLS-DA
baked_pls <- opls(ingredients, baked_goods$type)

PLS-DA with ropls

PLS-DA
30 samples x 29 variables and 1 response
standard scaling of predictors and response(s)
      R2X(cum) R2Y(cum) Q2(cum) RMSEE pre ort pR2Y  pQ2
Total     0.11    0.742   0.521  0.26   1   0 0.05 0.05
Warning: Single component model: only 'overview' and 'permutation' (in case of
single response (O)PLS(-DA)) plots available

Orthogonal PLS-DA

  • Orthogonal PLS-DA (OPLS-DA) finds a single predictive axis that separates 2 categories

  • Other axes are orthogonal—they’re not related to difference between cupcakes & muffins (e.g.)

  • Usually not recommended, but in the case of a single predictive axis with PLS-DA, it allows us to visualize results

OPLS-DA with ropls

  1. Try OPLS-DA
baked_opls <- opls(ingredients, baked_goods$type, predI = 1, orthoI = NA)

OPLS-DA with ropls

OPLS-DA
30 samples x 29 variables and 1 response
standard scaling of predictors and response(s)
      R2X(cum) R2Y(cum) Q2(cum) RMSEE pre ort pR2Y  pQ2
Total    0.189    0.832    0.58 0.214   1   1 0.05 0.05

OPLS-DA with ropls

  1. Interpret statistics
OPLS-DA
30 samples x 29 variables and 1 response
standard scaling of predictors and response(s)
      R2X(cum) R2Y(cum) Q2(cum) RMSEE pre ort pR2Y  pQ2
Total    0.189    0.832    0.58 0.214   1   1 0.05 0.05
  • \(R^2_X\)(cum) = How much variation in ingredients is explained by the axes

  • \(R^2_Y\)(cum) = How much of the response (cupcake vs. muffin) is explained by the axes

  • \(Q^2\)(cum) = Predictive power of the model—should be close to R2Y, but will always be lower

OPLS-DA with ropls

  1. Interpret statistics
OPLS-DA
30 samples x 29 variables and 1 response
standard scaling of predictors and response(s)
      R2X(cum) R2Y(cum) Q2(cum) RMSEE pre ort pR2Y  pQ2
Total    0.189    0.832    0.58 0.214   1   1 0.05 0.05
  • RMSEE = Square root of the mean error between the actual and the predicted responses

  • pre, ort = Number of predictive and orthogonal axes

  • pR2Y, pQ2 = p-values from permutation tests

OPLS-DA with ropls

  1. Increase number of permutations
baked_opls <- 
  opls(ingredients, baked_goods$type, predI = 1, orthoI = NA, permI = 999)

OPLS-DA with ropls

OPLS-DA
30 samples x 29 variables and 1 response
standard scaling of predictors and response(s)
      R2X(cum) R2Y(cum) Q2(cum) RMSEE pre ort    pR2Y   pQ2
Total    0.189    0.832    0.58 0.214   1   1 0.00501 0.001

OPLS-DA with ropls

  1. Customize plot
# score plot
plot(baked_opls, typeVc = "x-score")
# correlation plot
plot(baked_opls, typeVc = "correlation")
# Or build your own from scores and loadings
scores <- bind_cols(
  getScoreMN(baked_opls, orthoL = FALSE),
  getScoreMN(baked_opls, orthoL = TRUE)
) |> add_column(type = baked_goods$type)
loadings <- getLoadingMN(baked_opls) |> as_tibble(rownames = "ingredient")

Now you try

  1. With the penguins dataset, try re-doing PCA using the ropls package. In what ways is the result the same? In what ways is it different?
  2. Now try using PLS-DA to determine if penguins differ in morphology by species1

Getting Help

Further Reading

References

Hidalgo, Bertha, and Melody Goodman. 2013. “Multivariate or Multivariable Regression?” American Journal of Public Health 103 (1): 39–40. https://doi.org/10.2105/ajph.2012.300897.
Scott, Eric R. 2019. “Cupcakes Vs Muffins: Round 2.” www.ericrscott.com/post/cupcakes-vs-muffins-round-2/.